Table of Contents
ToggleHow We Increased e-Commerce Revenue by Optimizing PPC and Paid Search
We recently had the chance to work on a campaign to increase e-Commerce revenue for Google Search and Facebook Ads for a consumer electronics manufacturer. The client came to us with active campaigns but in a relationship with a vendor that had gone stale, looking for a fresh set of eyes to maximize their spend and find areas for growth. They wanted to make sure they were budgeting properly and getting the best return on ad spend (ROAS).
Naturally, we rolled up our sleeves and got right to it. Our first step is to look at the data available and the active marketing campaigns to see where we can introduce change without causing disruption. The goal is to find improvement but protect what is working.
Some of our best work for clients is when we have the chance to optimize across multiple channels. Many cases when you have a successful product advertising may do well in-spite of a less than perfect ad setup. That’s where we can find waste and make sure dollars are being best spent.
Prioritize and Optimize Sales Sources by Paying Attention to Multi-Channel Attribution Models
In this case, we start by looking closely at Time Decay and Position Based attribution models in Google Analytics. By looking at these different models we can understand how things like Google Ads, Facebook Ads, and organic search play a role in the journey a user takes to purchase. Retailers should review and pick the most appropriate attribution models for e-commerce reporting.
Simply put, these cross-channel attribution models give credit for engagement prior to the conversion, rather than just the last click always getting the credit.
In this case, about 60% of purchases needed 2+ visits to convert. That is a lot of users who engaged with the brand several times before purchase. So to better understand that we can compare attribution models to give credit for some of that activity. We’ll look specifically at the values of Time Decay and Position Based attribution models.
The majority of users who return to purchase most often do so direct means or branded paid search. When we look at the Model Comparison Tool you can see the increased value (highlighted in red in the above graphic) put on Social and Paid Search channels as we look at time decay and position based attribution models.
You also see the decrease in value for direct traffic because of the nature of how users convert on this site. We confirm this by looking at the Assisted Conversions report and looking at the Assisted Conversion metric in the last column – as defined by Google:
A value close to 0 indicates that this channel functioned primarily as the final conversion interaction. A value close to 1 indicates that this channel functioned equally in an assist role and as the final conversion interaction. The more this value exceeds 1, the more this channel functioned in an assist role.
Social media often plays an early role, but much less factor near the end of the conversion path. Knowing that insight is helpful, and helped support and prioritize our strategy:
- Reduce waste on Facebook and increase return on ad spend
- Improve CPA (cost per acquisition) for Google Search Ads
Making decisions on where to focus the attention on improvement becomes much easier now when you see how buyers engaged with different channels. Keying in on the performance of each channel helps us understand it’s role in our buyer’s journey. By understanding our audience and what role a marketing channel like Facebook plays, we can best optimize that platform.
Reduce Waste on Ad Spend by Looking at the Whole Strategy
Nobody wastes money on purpose. At least not the kind of everyday working people we interface with. So we start with the waste. It’s always a win. In this example, our ad budget (roughly $10k monthly) has roughly 75-80% allocated for Facebook so that’s where we’ll begin.
For simplicity and for our improvement plan we start by documenting the active Facebook campaigns and note a few observations.
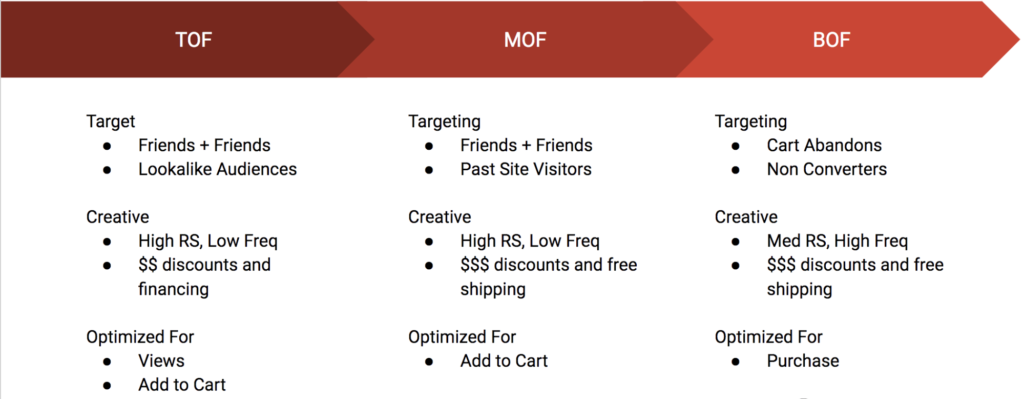
The top of the funnel (TOF) campaign was driving traffic at high volumes and ads with high relevance scores. Frequency was low and we had too broad a target. Both video and image ads are included in the placements with a mix of objectives among the active ad sets.
Custom audiences are used starting with the middle of the funnel (MOF) campaign which features ads running with really high relevance scores but low frequency. This campaign was set for optimization towards Facebook’s Add to Cart conversion.
At the bottom of the funnel (BOF) the campaign is designed to hit non-converters and cart-abandons using Facebook’s Custom Audiences. This was working well overall and was the most stable of the three active campaigns.
A few things started to boil to the top during our review.
- High relevance scores are getting us cost-effective inventory, but too many ads have low CTRs. Creative focuses a lot on pricing (this is a $500+ product w/ options), rather than features earlier in the funnel.
- Low frequency in the top and middle of funnel campaigns, creating a bottleneck for remarketing later in the funnel and ultimately conversions. This is often a sign ad budgets are spread too thin.
- No consistent audience targeting strategy being used. Ads were firing to everybody with a pulse across the country.
Proven Steps to Reduce Cost of Facebook Ads for e-Commerce
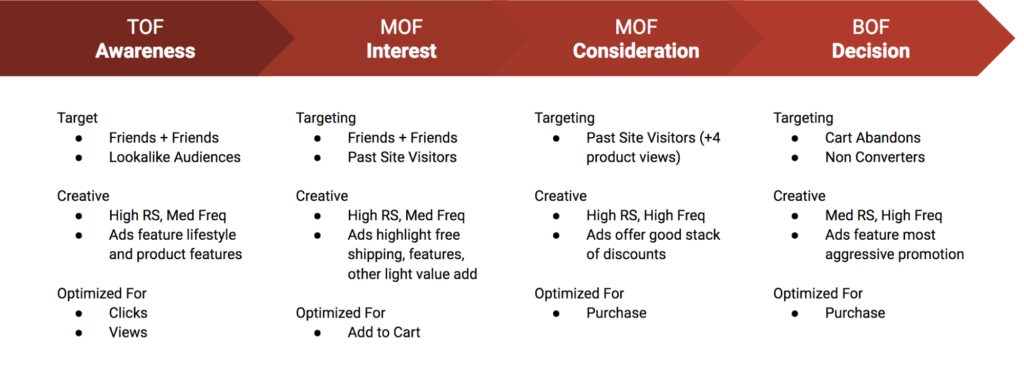
Enter our revised Facebook campaign plan. A little bit more detailed in the middle of the funnel so we can better align our messaging with our audience and a progressive promotions plan instead of giving everything away immediately.
Targeting Audiences Based on Past Conversion Data
First order of business was to get the targeting cleaned up with the intent of increasing frequency for our ads and getting higher quality traffic overall.
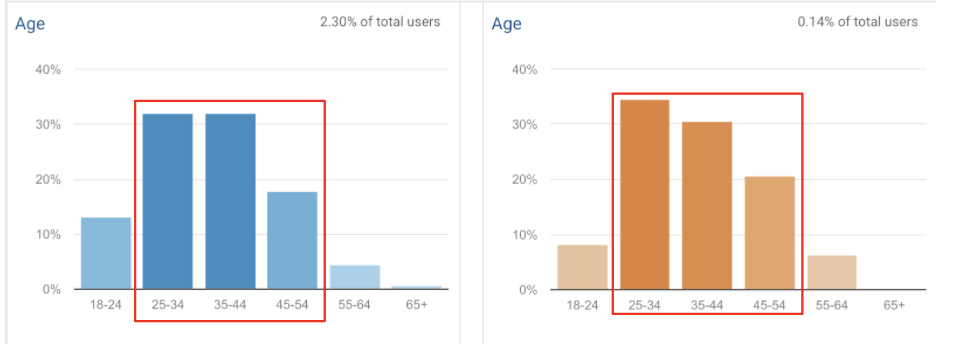
Using segments in Google Analytics we look at data specifically about the makeup of converters. To start we took a look at top age brackets that added to the cart (left) or purchased (right).
Very clearly we see 25-54 is the best age range for sales. It’s also interesting to quickly see the cart abandons for the 18-24 range so high but we’ll cover that a bit further along.
All the ads in the accounts were targeting all ages across the country. By focusing on the best-converting audience, we can narrow our audience targets and our ads will have a greater impact.
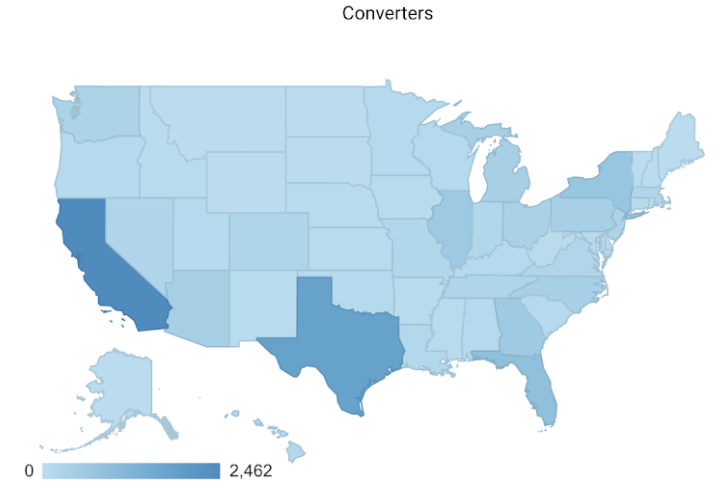
In addition to age, we wanted to tighten up the geographic targeting for areas that made the most sense. We started by identifying states with < 5 conversions in 90 days.
We decided to exclude 11 states from our targeting to start and have a few more right on the cut line.
Updated Ads to Help Increase CTR
The revised Facebook ads highlight the product features for use in the top of the funnel advertisements. The new creative went into the rotation and made a quick splash, creating a 175% lift in clicks from our Facebook ads.

We cut several different outdated ads out of the rotation. We went from 90+ ads down to a pool of less than 20. Mainly influencer video content that had worked well but had run their course. We found repetitive, low-quality ads that had been copied over and over all through the campaigns.
Fix those relevant scores, and save some money. Facebook is clear about that in their documentation.
A few additional notes:
- Existing ads featured emojis. We saw these ads had high relevance scores and stronger CTRs than those without. We continued to use emojis in the text of our revised ads.
- Our image was a product shot with 4-5 main features of the product in the text (and still passing the text overlay tool). A few color and product shot variations but nothing too complicated.
- We didn’t want to ignore the 18-24 demographic with high abandon rates (as well as some targeting on HH income). New ads were added to the BOF campaign that targets the 18-24 group with easy financing options.
- Two particular ad sets were a noticeable drain on ad spend and averaging 15x higher CPA than the rest of the ad set.
In the first month, we cut the Facebook ad spend by 11% and saw a slight increase in revenue. ROAS went from 1.65 to 1.85.
Quick Formula to Calculate Return on Ad Spend (ROAS)
Revenue / Cost = ROAS. Divide the revenue driven by advertising by the amount that is spent on that advertising. Use ROAS to track sales performance by channel. It will help you understand if your campaign is profitable, or if it has been improving in profitability over time.
How We Improved CPA and ROAS for Google Search Ads
In our case, Adwords was being used for branded search and generating a positive ROAS. We started by looking immediately at conversion activity at the keyword level using the search phrase report.
When using match type keywords in Adwords or Bing you have to be very good about monitoring the phrase variations that start to pop up. View this in the search phrase report for any group or specific keyword. Use negative keywords or stronger match types to keep this under control.
We provide a crash course on using the Search Query Report this in another article about using Adwords PPC data to make better marketing decisions. Here the SQR helps us find a eliminate waste.
 We identified a match phrase spending 2.5x the others but converting at a dismal rate (highlighted above in red). By tightening up this match type and working in a few negative keyphrases we were able to greatly increase ROAS.
We also introduced remarketing to help create additional touchpoints at the bottom of the funnel, outside of Facebook. Since we have such a huge return on the search ads we may find that remarketing with Google Display is more cost-effective.

The campaign was already performing well, with the benchmark for current ROAS averaging 10.5 over 3 months. Ecommerce conversions (transactions) increased by 25% in the first few weeks after the updates to our campaign.
But the increase in conversions is more of a vanity metric in this case. We need to look at an improved ROI to be successful for this client. After improving the keyword matching, adding negatives and tightening up our demographic targeting, we increased Adwords ROAS from 10.5 to 19.83 without a budget increase.
Results
Working with multiple channels for paid marketing can create a whole new stream of optimization opportunities. Unfortunately, it can also provide a lot of pockets where waste can build up. Changes in platform, ad requirements or even product messaging can create an outdated marketing funnel if you are not careful.
In this case- by eliminating the waste, improving targeting and updating the creative we were able to drive a 30% increase in revenue using the same working budget.
e-Commerce Sales Increased $36,700 in 30 Days
Be sure to actively track channel performance as a whole and for channels independently to continue improving and prevent waste. Need help improving ad performance with a focus on conversions? We can help. Schedule your site review with us and find out how.


